
Heat Waves: Effects on Mortality in Metropolitan France from 1970 to 2013, with a Focus on the Summers of 2006 and 2015
Santé publique France has published two new reports: the first examines the population’s exposure to heat waves and their impact on mortality between 1970 and 2013; the second assesses excess mortality during the heat waves of the summers of 2006 and 2015.
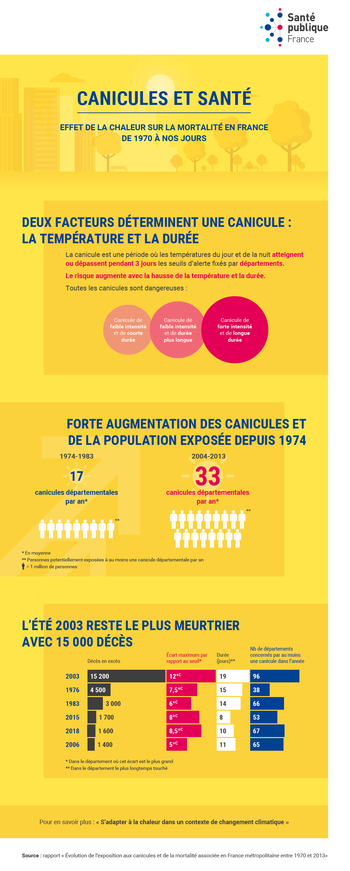
Mortality rates and healthcare utilization rise when it is hot. Extremely high temperatures, such as those experienced during heat waves, can lead to a rapid and significant increase in excess mortality. This is what happened in August 2003, when an excess of approximately 15,000 deaths was observed. The National Heat Wave Plan (PNC) was implemented, and in 2004, the Heat Wave and Health Alert System (SACS) was developed by Météo-France and Santé publique France. Both systems enable the anticipation of heat waves and the mitigation of their consequences by mobilizing the entire country in the event of intense heat (orange or red alert).
Trends since 1970
The study “Trends in Heat Wave Exposure and Associated Mortality in Metropolitan France Between 1970 and 2013” cataloged all heat waves that occurred in metropolitan France over the past 40 years, using the Heat Wave and Health Alert System approach retrospectively.
The results highlight a clear increase in the number of heat waves and the population exposed over the decades. Nationally, the size of the population exposed to at least one heat wave per year doubled between the 1974–1983 decade and the 2004–2013 decade. Before the heat wave plan was implemented in 2004, an average of 18 departmental heat waves occurred each year. Since 2004, an average of 40 have been observed annually.
Nearly 32,000 excess deaths were recorded across all 921 heat waves identified between 1974 and 2013, half of which occurred in 2003—a year with no historical precedent.
Annual reports from the heat wave and health alert system help complete the data series for the most recent years. The years 2015, 2016, 2017, and 2018 were marked by significant heat waves resulting in nearly 4,000 excess deaths.
Focus on the summers of 2006 and 2015
The study “Assessment of Excess Mortality During the Heat Waves of the Summers of 2006 and 2015 in Metropolitan France” provides a detailed assessment of the excess mortality observed during the heat waves of 2006 and 2015 (by sex, age, and department) using the same methodology and based on comprehensive death data provided by INSEE. In 2006, a 10% increase in mortality was observed during heat waves. In 2015, the increase was 17%. Regardless of gender, this excess mortality is observed primarily in older age groups, specifically those aged 45 and older.
Why and how should we adapt to heat waves?
The observed increases in heat waves are consistent with expected trends in the context of climate change. We should expect to see more and more episodes of this type (or episodes of extreme heat). This underscores the importance of evaluating existing prevention measures and integrating them into a comprehensive approach to climate change adaptation, based on early warnings and fundamental prevention strategies (training, reducing the urban heat island effect, improving thermal comfort, etc.). The adoption by everyone of simple, cautious behaviors and attitudes of solidarity—particularly between generations—is central to prevention. All of these elements, along with a timeline of heat waves in metropolitan France since 2003, are covered in the public summary “Adapting to Heat in the Context of Climate Change,” updated in April 2019.
Box – Access heat-related indicators dating back to 1974 on Géodes
Annual heat-related indicators can be viewed and exported on Géodes, the cartographic observatory of Santé publique France:
cumulative degrees above thresholds during heatwave periods;
increase in mortality observed during heat waves: number, proportion, and excess death rate.
All these indicators are available by department and by year from 1974 to 2018.
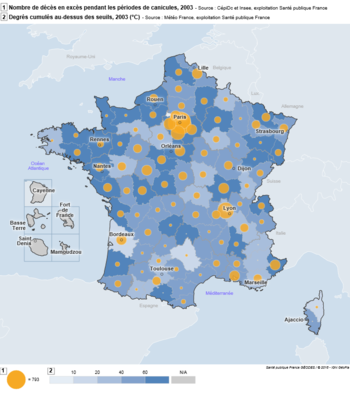
In the image: Department-level mapping of two indicators during the 2003 heatwave: excess mortality and temperatures above thresholds
Géodes (Geodata on Health Epidemiology) presents, in the form of maps, over 300 indicators developed by Santé publique France from numerous sources: medical-administrative data, health surveys, surveillance systems, registry data, and more.
Classified by disease or health determinant, most indicators are produced annually, with some dating back several decades. For indicators derived from emergency room visits and SOS Médecins consultations, updates are provided weekly.
Géodes is accessible to everyone and offers numerous features: view indicators for a disease or health determinant for a department or region in map form; analyze trends in indicators over time; print and share maps, tables, and summary sheets...
Tutorials are available on the homepage.
FOR MORE INFORMATION:
Trends in heat wave exposure and associated mortality in mainland France between 1970 and 2013. Report.
Adapting to Heat in the Context of Climate Change, 2nd edition. Santé publique France. April 2019. Summary.
Climate Change Dossier
Extreme Heat and Heat Wave Dossier
The Météo-France alert map provides updates twice a day on temperature trends: